For optimal reading, please switch to desktop mode.
Background
Disk monitoring typically draws attention when a drive starts misbehaving. Historically in our clients' OpenStack systems, we only found out that a drive had failed when we noticed errors bubbling up in services such as Ceph. To improve visibility, we initially introduced two shell scripts to handle monitoring: one for general SMART data and another for NVMe-specific metrics. However, as our requirements changed, and our need for better dashboards grew, that split became more work.
Over a series of changes, we moved from two shell scripts to a Python-based collector that gives us richer NVMe metrics, better DWPD reporting, insightful Grafana dashboards, and a simpler deployment model. In this post, we look at how that monitoring evolved, why the earlier approach needed to change, and what the newer setup now makes possible.
The original approach
The original setup was practical and did what we needed at the time. Disk health information was collected locally on each node using smartctl and nvme-cli. A cron job periodically ran the scripts and wrote their output to files read by the Prometheus node exporter textfile collector.
The smartctl script handled SMART data more generally across all the disks, while the second nvme-cli script handled NVMe-specific metrics. This allowed us to collect NVMe endurance data such as terabytes written (TBW).
The nvme-cli script gave us useful data. It exposed metrics that we could not get out of smartctl at the time. As time went on, we also extended the NVMe script to introduce rated drive writes per day (DWPD). More on this below.
DWPD and endurance monitoring
One of the more useful additions to the monitoring stack is rated DWPD support.
Raw write counters do not tell the whole story by themselves. A large amount of write activity may be expected for one class of drive and a warning sign for another. By loading rated DWPD values from a dwpd_ratings.json file, the collector can expose the manufacturer-stated DWPD ratings alongside observed write activity. This makes it much easier to build dashboards and alerts that reflect the endurance of the actual hardware.
A simple ratings file might look something like this:
[
  {
    "model_name": "INTEL SSDPE2KX010T8",
    "rated_dwpd": 1.0
  }
]
We also have a helper playbook that makes it easier to discover the exact model strings needed to populate this file for your own hardware.
Why it needed to change
As SMART monitoring reached more client sites, we started to find gaps. Some clouds had drive layouts we had not covered properly, and occasionally drives that operators expected to see in Grafana were missing.
This showed us that we needed a better way to test the scripts against examples from real client sites. To do this, we decided to rewrite the smartctl script in Python. That gave us two useful improvements:
- We could run end-to-end tests more easily.
- We could use existing Python libraries instead of doing everything in shell.
With this in mind, we rewrote the smartctl script in Python and used the pySMART library to help run and parse smartctl commands.
Moving NVMe into smartmon.py
As we added more NVMe-specific metrics to the dashboards, maintaining two paths for the same monitoring job became harder to justify. We also wanted more consistency between collectors, dashboards, and alerts.
We decided to extend smartmon.py to include collecting and reporting on NVMe devices. As we had already adopted pySMART, this change was relatively straightforward. We were now able to get metrics such as TBW from a single script. After updating the Grafana dashboards to use the new metrics, the NVMe dashboards were working from the same collector as the rest of the SMART data.
We also added tests around the new NVMe support. These tests use real smartctl JSON output, which means we can check how the collector behaves against examples taken from real systems.
This is useful because different client sites can have different drive models and layouts. By using sample output from those sites, we can mock those setups in tests and check that the collector still produces the metrics the dashboards expect.
Dashboards
The Hardware Overview dashboard provides a broad operational picture. It includes a table of NVMe devices and key health information, and shows metrics such as critical warnings, temperature, capacity, data read and written, and rated DWPD.
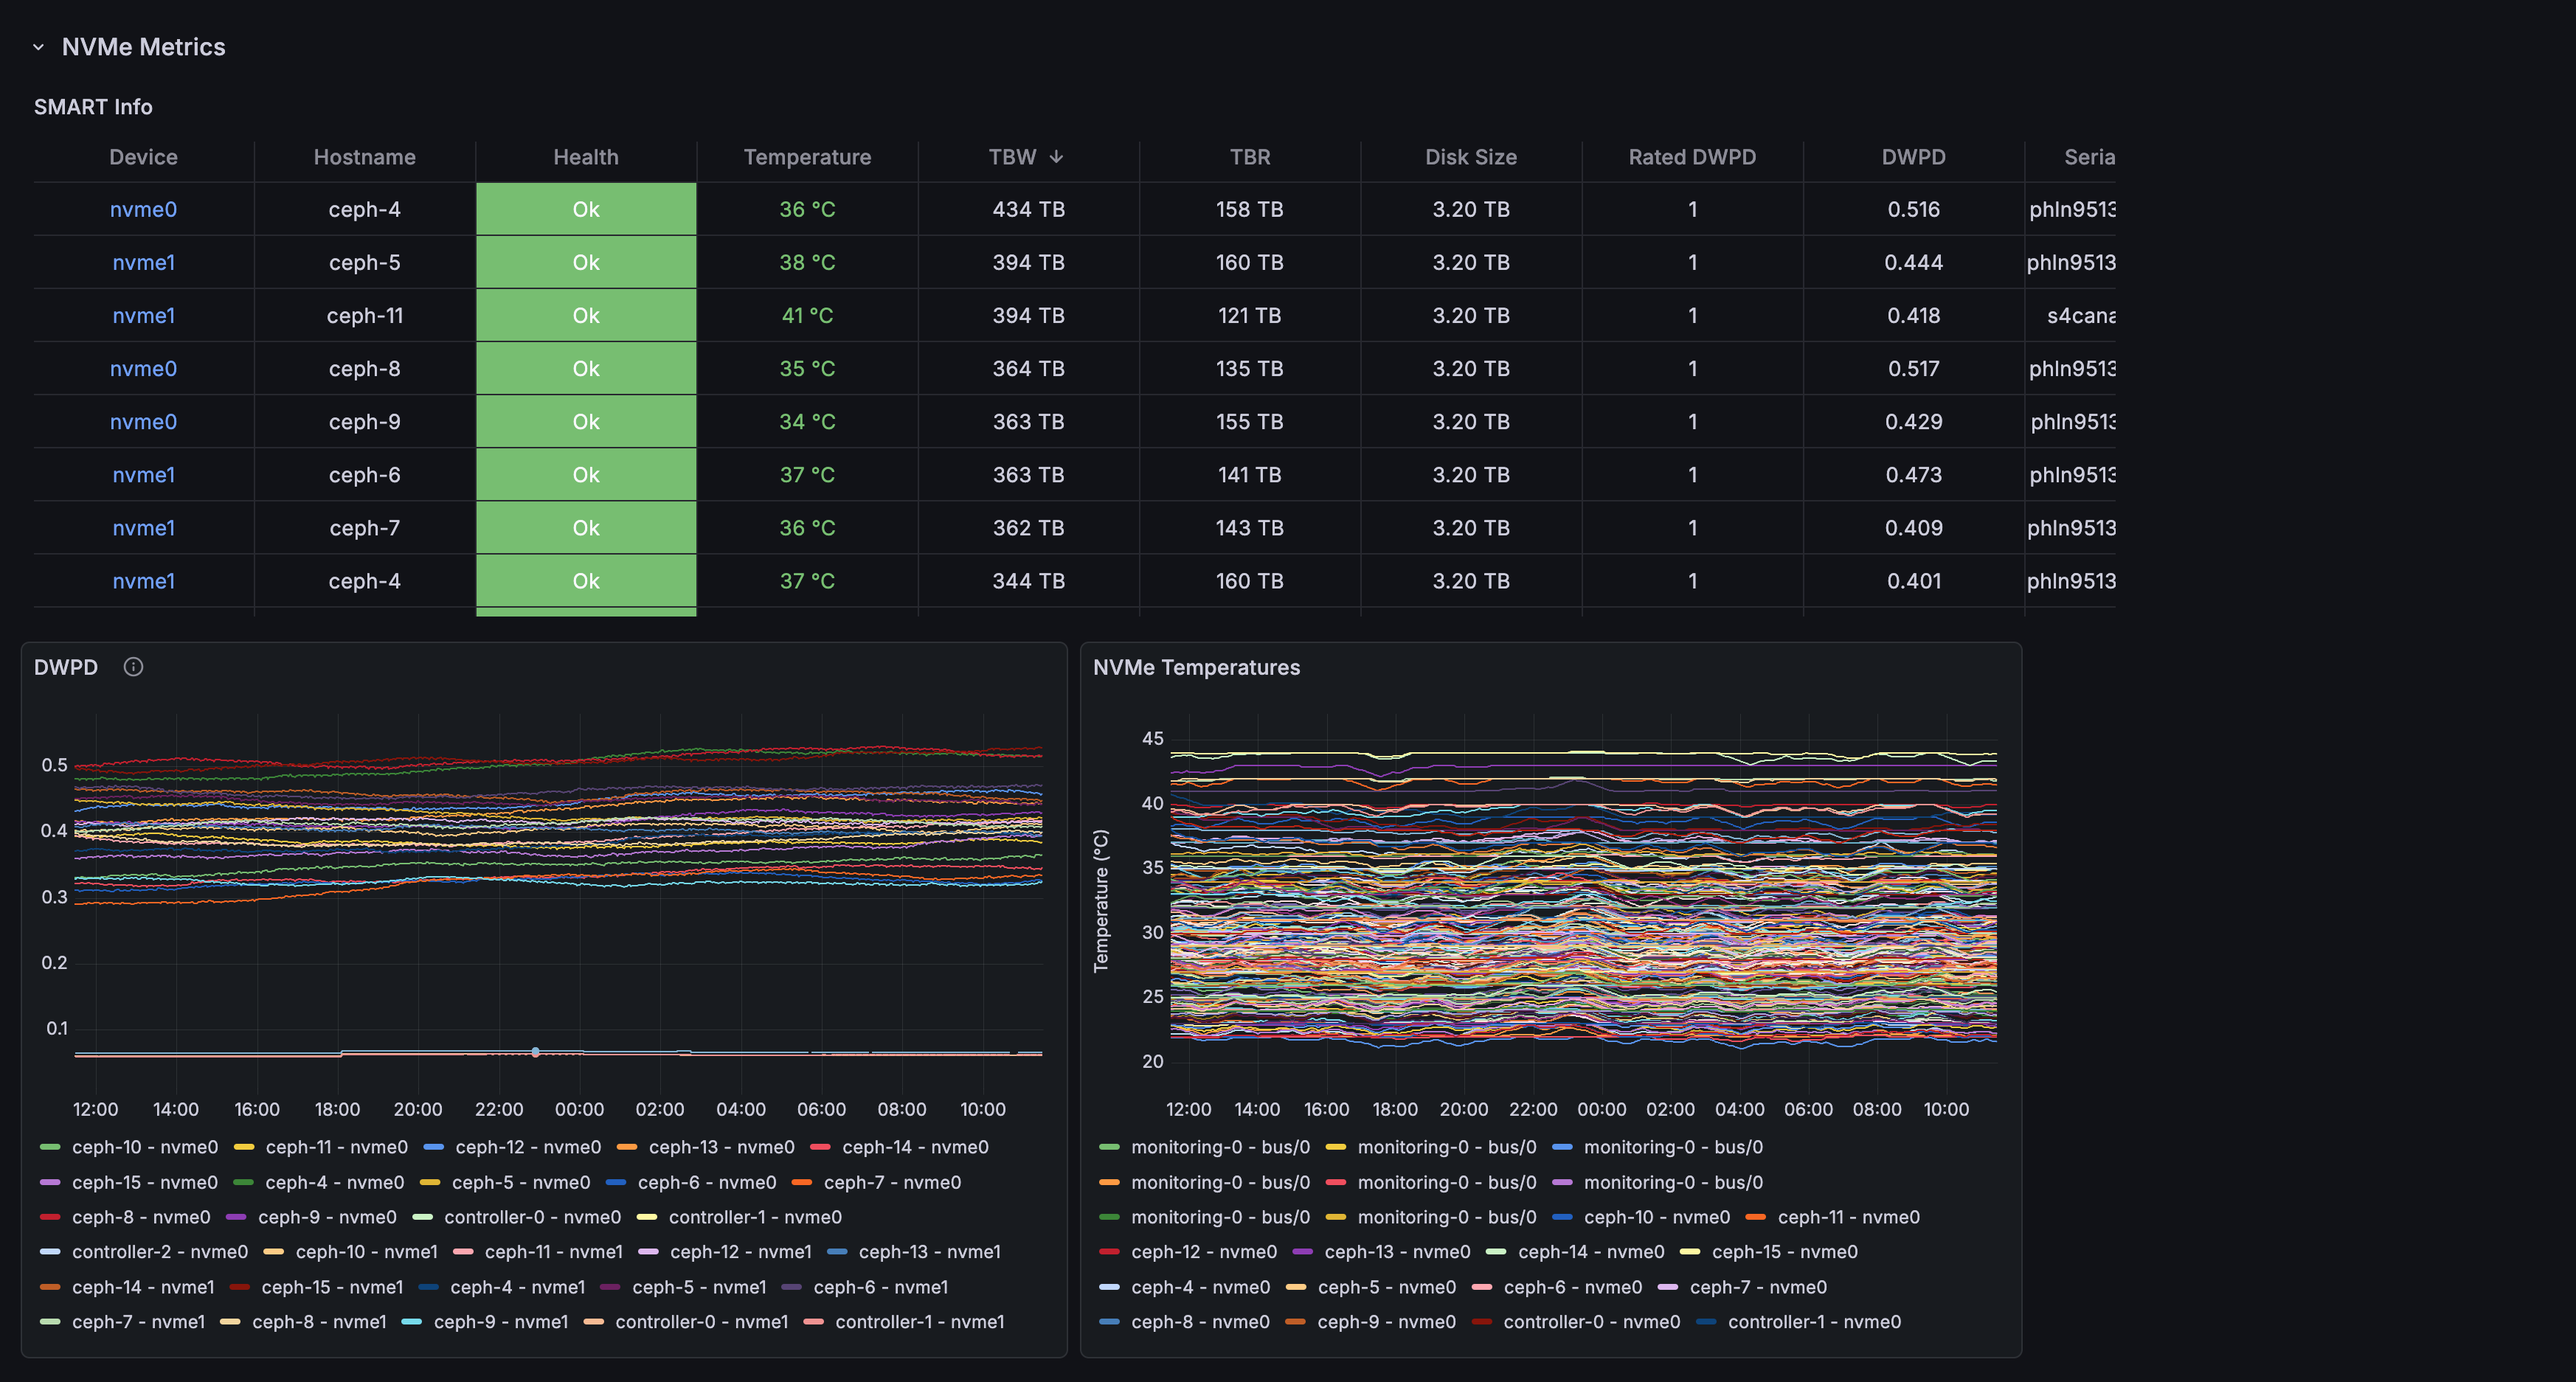
For closer inspection there is also the NVMe Monitoring dashboard. This dashboard is driven by serial numbers and focuses on a single device at a time. It is also a click-through dashboard meaning that from the Hardware Overview dashboard, an operator can click an NVMe drive and jump straight to the single-drive view for that device. This makes it much easier to drill down into a drive with suspected issues.
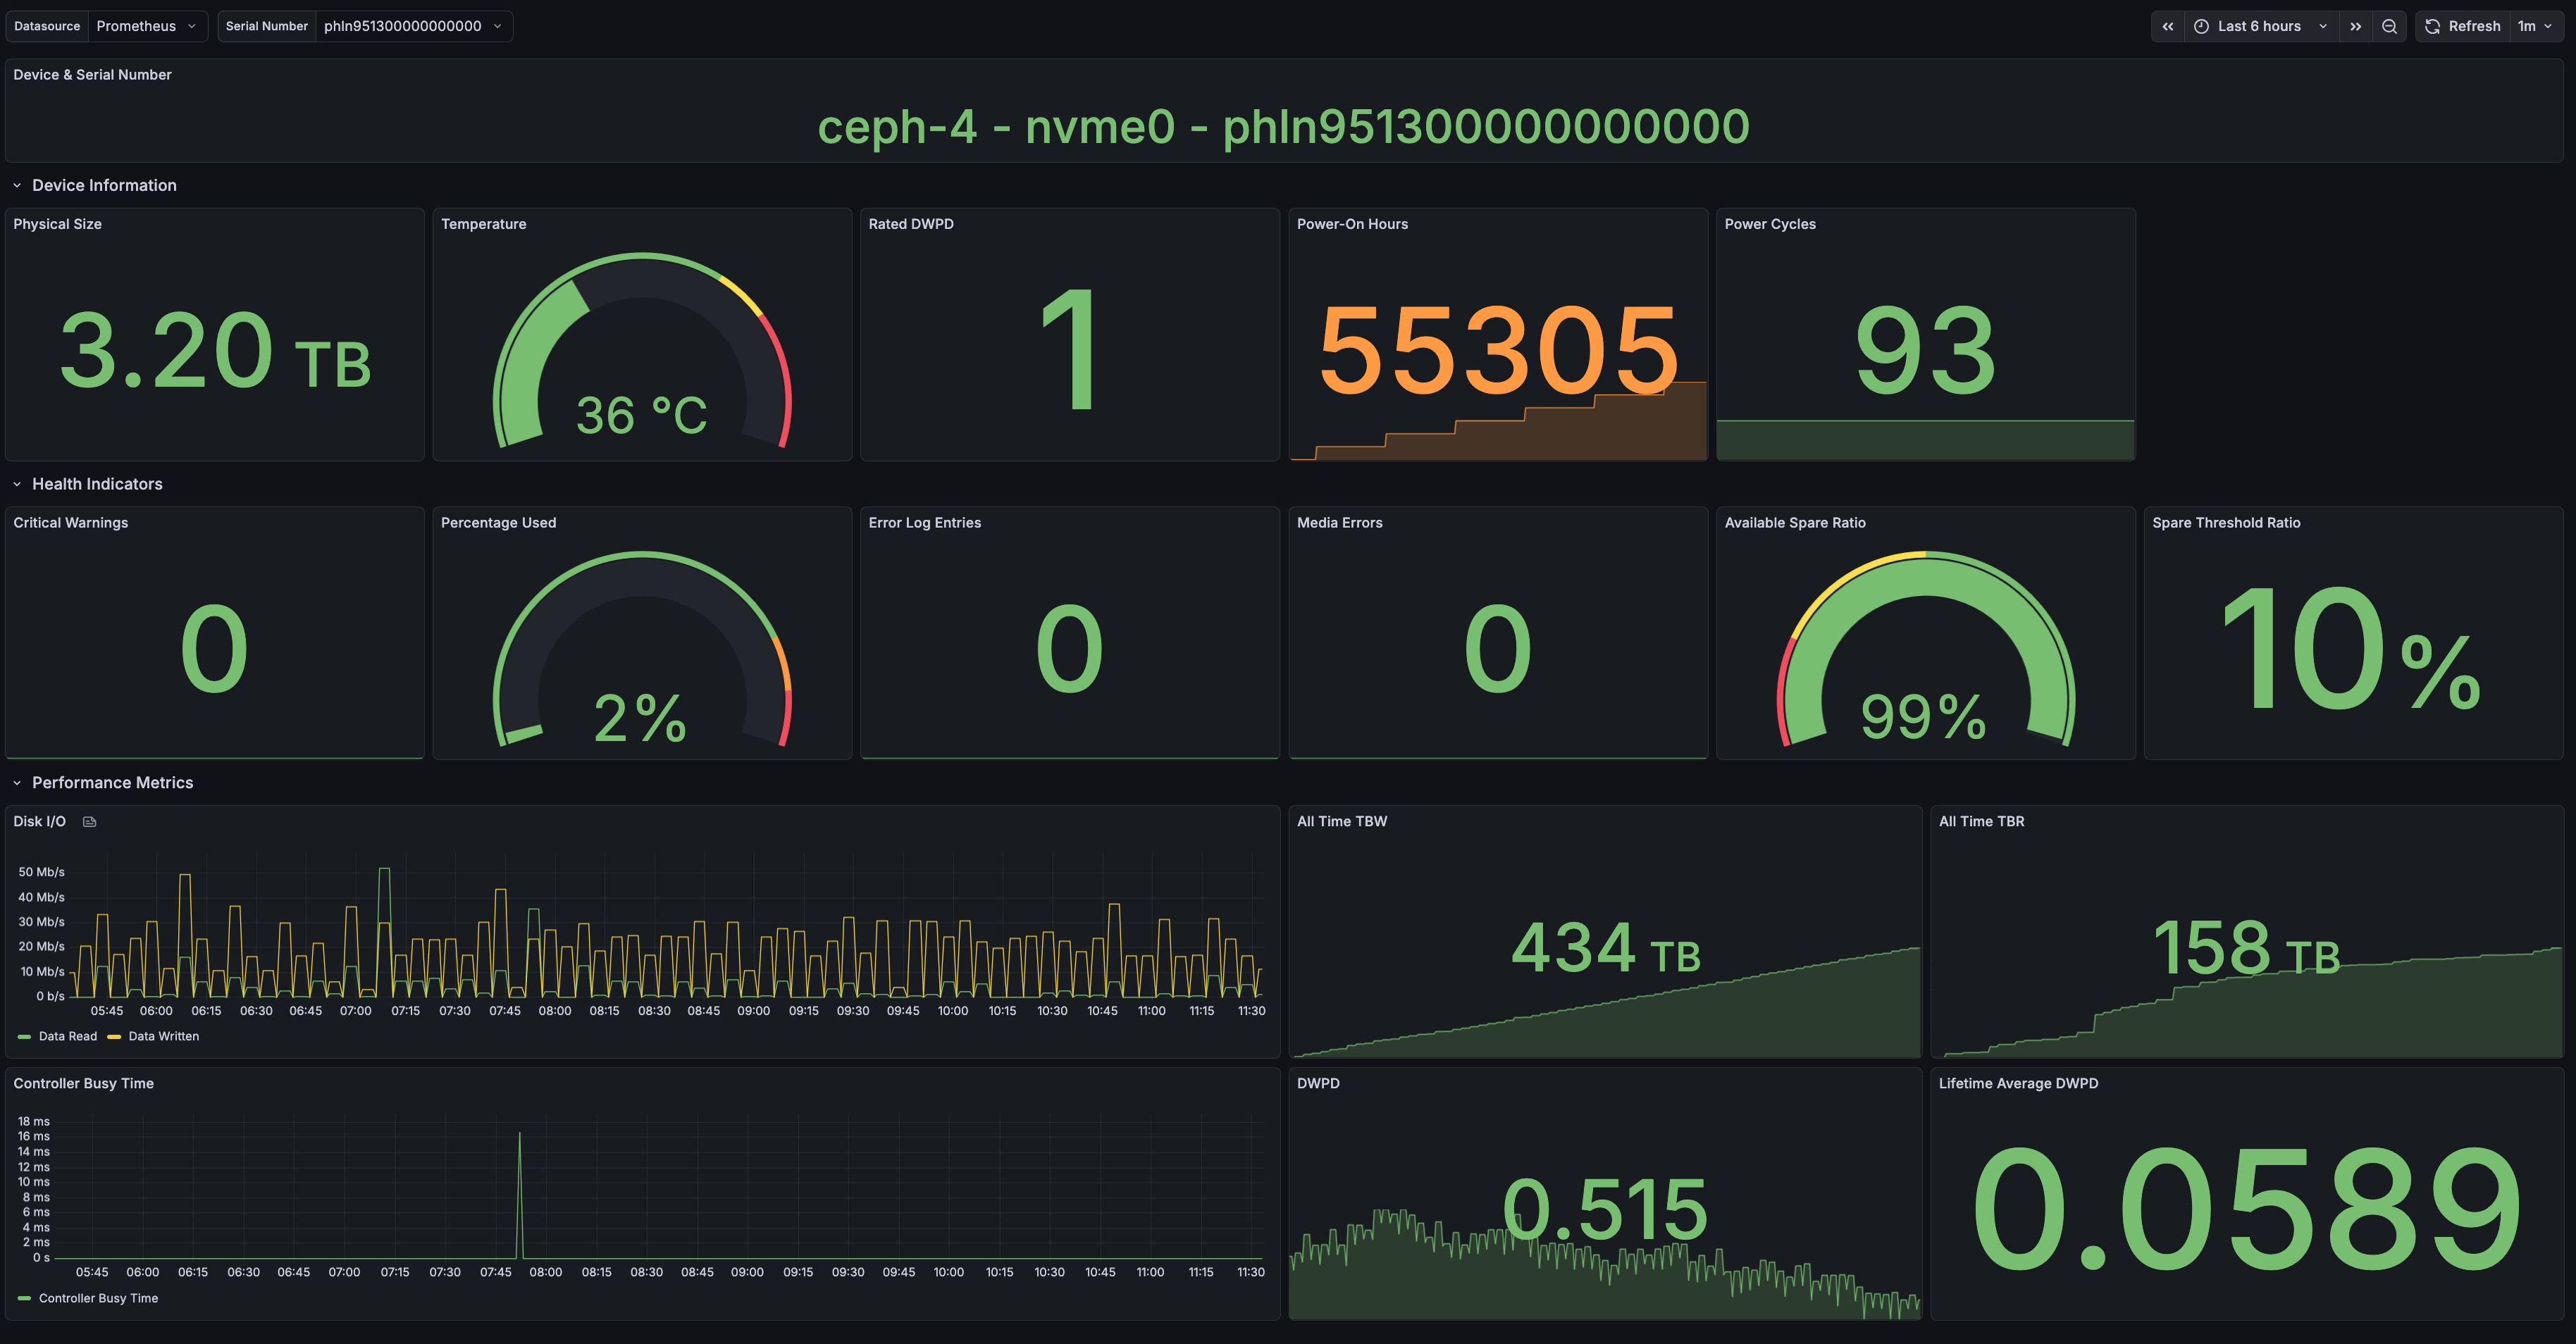
It includes panels for capacity, temperature, rated DWPD, power-on hours, critical warnings, error counts, read and write rates, and lifetime write usage.
Getting it running
If you have the latest checkout of StackHPC Kayobe Config, you can get these monitoring improvements set up on your system.
First, ensure Prometheus and Grafana have the latest config and dashboards:
kayobe overcloud service reconfigure -kt grafana,prometheus
The SMART monitoring tooling can then be deployed with:
cd etc/kayobe
kayobe playbook run ansible/smartmon-tools.yml
For environments using rated DWPD values, operators can also get the smartmon-tools playbook to scan the cloud for NVMe models and use that output to populate the ratings file:
kayobe playbook run ansible/smartmon-tools.yml -e create_dwpd_ratings=true
Once the rated DWPD values have been filled in, run the smartmon-tools playbook again:
kayobe playbook run ansible/smartmon-tools.yml
Once deployed, take a look at the Hardware Overview dashboard in Grafana. If a particular NVMe device looks problematic, the dedicated NVMe Monitoring dashboard can provide a more detailed per-device view.
What next?
There is still more to do. Monitoring work tends to accumulate edge cases as it meets more hardware, and with the more fine-grained metrics, alerting can always be refined.
That being said, the current setup is already a substantial improvement over the original split between smartmon.sh and nvmemon.sh. The monitoring now has fewer parts, better test coverage, and clearer dashboards for deciding whether a drive is healthy, busy, or starting to fail.